
Ofsted and Performance Data
School Performance Data 2024 – 2025
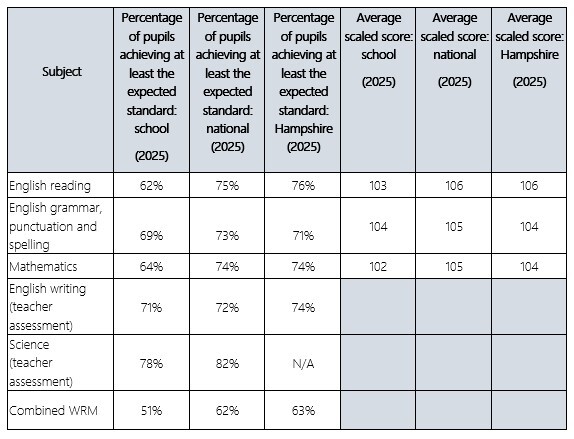
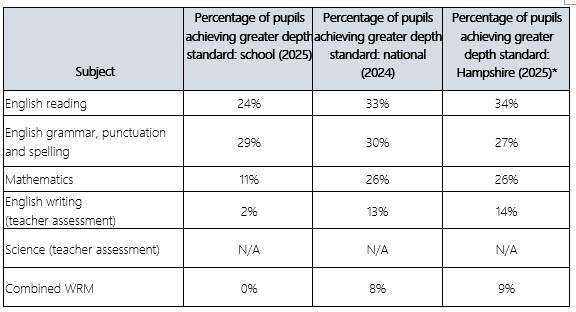
Below are the results for the tests taken in Summer 2025. More detail about the KS2 results can be found on the website below, where you can also compare performance with similar schools from around the country.
Key Stage 2 Comparative Report 2024/25
This information allows you to compare your child’s performance at the end of Key Stage 2 with the attainment of other Year 6 pupils in our local authority and across England in 2025.
Ofsted Report
Please find below our most recent Ofsted reports and relevant information from the Department for Education Performance Tables.